How to Choose Better Solar Panels in 2026?
Choosing better solar panels in 2026 requires more than comparing wattage and glossy efficiency labels. A panel that performs well on a showroom roof may behave differently under heat, dust, snow, or partial shade. Your roof, electricity use, local climate, and available installation space should guide the decision. Small details matter.
Start with independently verified specifications. Check the module’s efficiency, temperature coefficient, expected degradation, and performance warranty. Look for recognized testing standards, such as IEC certification, and review the manufacturer’s service history. A 440-watt panel is not automatically better than a 420-watt model. Higher output can help on a small roof, but it may bring higher costs or more difficult handling. Ask for the complete datasheet, not just a sales brochure.
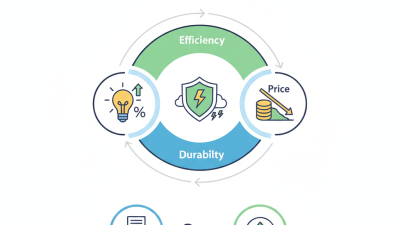
A reliable installer should explain shading losses, roof structure, inverter compatibility, and likely annual production. Request at least two detailed quotes with equipment models clearly listed. Inspect warranty terms carefully, including labor coverage and the process for making a claim. Better solar decisions come from measured evidence, not confident promises. Even experienced buyers can overlook maintenance access or future roof repairs. I would not pretend every recommendation is perfect; product data changes, and real-world performance can fall below estimates. Leave room for revision after a site survey. The best choice balances durability, verified performance, total ownership cost, and the installer’s accountability over many years.
Solar Panel Types and Their Key Performance Differences
Choosing better solar panels starts with their cell type, not the largest number on the label. Monocrystalline silicon panels usually deliver the highest power per square meter. The Fraunhofer ISE Photovoltaics Report 2024 records leading commercial silicon modules above 23% efficiency. That matters on a small roof. Polycrystalline panels remain usable, but their lower efficiency often requires more installation area. Their market presence is also declining.
Thin-film panels behave differently. They usually offer lower efficiency, yet perform more steadily in heat, weak sunlight, and partial shading. This can help on large roofs with flexible layouts. The International Technology Roadmap for Photovoltaic, 2024 edition, tracks a rapid shift from p-type to n-type silicon cells. TOPCon and heterojunction designs can improve efficiency, bifacial response, and long-term stability. However, results vary between products. Read the temperature coefficient, degradation warranty, and low-light data.
Do not ignore installation conditions. A panel rated at 450 watts may lose more output on a hot metal roof than its laboratory figure suggests. Check the temperature coefficient carefully. A lower value is better. Bifacial panels need reflective ground and suitable mounting height; a dark roof may provide little rear-side gain. Thin-film panels can also need more space and additional structural planning. I would question any claim without test conditions, uncertainty ranges, or an independent certification reference. Datasheets are useful, but real roofs are messier.
How to Choose Better Solar Panels in 2026?
Solar Panel Types and Their Key Performance Differences
The chart uses representative values for commercially available modules. TOPCon and HJT typically deliver higher module efficiency than conventional PERC silicon, while HJT generally maintains output better in hot conditions because of its lower temperature coefficient. Thin-film CdTe can perform well in high temperatures and low-light conditions, but usually has a lower nameplate efficiency and requires more installation area.
Actual performance varies by module design, installation conditions, irradiance, operating temperature, and manufacturer specifications. Temperature coefficient values are shown as the percentage power loss per 1°C increase above the rated test temperature.
How to Compare Efficiency, Power Output, and Real-World Performance
How to Choose Better Solar Panels in 2026?
Efficiency is useful, but it is not the whole decision. Fraunhofer ISE’s Photovoltaics Report shows commercial crystalline-silicon modules generally reaching the low-to-mid 20% range. A higher percentage means more electricity from limited roof space. It does not guarantee better annual production. Check rated power, temperature coefficient, low-light behavior, and warranty conditions. Small differences matter less than shade, orientation, and installation quality.
Power output needs context. A 450-watt panel will not produce 450 watts all day. Heat reduces output. Dust reduces it further. NREL degradation research commonly uses about 0.5% annual loss as a planning reference for established silicon technology. Ask for projected energy in kilowatt-hours, not only the nameplate rating. Compare estimates with hourly sunlight, winter shadows, and local temperature records. IEA PVPS reported roughly 456 gigawatts of new solar capacity worldwide in 2023. Rapid growth is clear, but global deployment does not prove equal performance on every roof.
Real-world evidence deserves more weight than a perfect specification sheet. Look for independent test data, verified degradation results, and clear measurement methods. I once favored the highest efficiency figure and overlooked a hotter roof section. That was a poor comparison. Measure the roof first. Then compare watts per square meter, expected annual yield, and long-term performance. Some uncertainty remains, especially where shading changes seasonally. Leave room for it.
Evaluating Durability, Degradation Rates, and Warranty Coverage
How to Choose Better Solar Panels in 2026?
Durability starts with the installation environment, not the brochure. Heat, humidity, wind, snow, and salt can stress a panel’s cells, frame, and seals. The IEA PVPS Task 13 report identifies moisture ingress, mechanical stress, and potential-induced degradation as recurring field concerns. Ask for testing evidence under IEC 61215 and IEC 61730. Certification helps, but it does not predict every rooftop’s future.
Degradation deserves a closer look. NREL’s analytical review found a median photovoltaic degradation rate of about 0.5% per year. That equals roughly 88% of the original output after 25 years, assuming steady decline. Real systems can perform differently.
Dust, shading, ventilation, and installation quality may matter more than laboratory figures. I would compare the stated annual degradation rate with independent field data, rather than trusting the smallest number.
Warranty language needs careful reading. Separate the product warranty from the performance warranty. Check coverage for labor, shipping, replacement, and claims after a company changes ownership. A 25-year promise sounds strong, yet exclusions can weaken it. Read the remedy clause. Does it offer repair, replacement, or only a partial payment? The IEA PVPS reliability literature also shows that failures may appear through connectors, junction boxes, and seals, not only the cells. I have seen buyers focus on efficiency and overlook these small components. That is an expensive blind spot.
Calculating Total Cost, Energy Savings, and Long-Term Value
How to Choose Better Solar Panels in 2026?
Calculating Total Cost, Energy Savings, and Long-Term Value
A panel’s price is only one part of its financial value. Calculate equipment, installation, wiring, permits, roof preparation, monitoring, and possible battery costs. Ask for an itemized quotation. Hidden labor charges can change the decision quickly.
Measure your yearly electricity use before comparing production estimates. A household using 8,000 kilowatt-hours annually needs a different system from one using 4,000. Compare projected output with your local sunlight conditions, roof direction, shading, and seasonal weather. Request assumptions in writing. Estimates are never perfect.
Look beyond the first-year savings. Panel degradation slowly reduces production, while an inverter may need replacement earlier than the panels. Include maintenance, financing interest, insurance changes, and expected electricity-rate increases. Then calculate the payback period and total savings over 20 or 25 years.
The math needs caution.
A simple example helps. If installation costs 18,000 dollars and annual savings begin at 1,500 dollars, the basic payback is twelve years. Real results may differ because electricity prices, household demand, and weather change. A lower-priced system can lose value if it produces less energy or needs frequent repairs. Check performance warranties, installer qualifications, local compliance, and documented project experience. Long-term value depends on reliable output, transparent terms, and a roof that can support the system for decades.